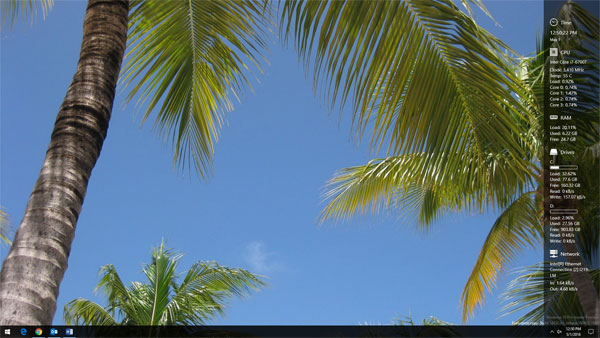
Keeping an eye on your system performance is a must for any power user but using Task Manager or Resource Monitor can be inconvenient. In Windows Vista Microsoft created sidebar gadgets that displayed useful performance information on the right side of your screen. Unfortunately, Microsoft pulled the feature from Windows due to “serious vulnerabilities.” Picking up where Microsoft left off, a new utility was created by Ryan K. (ArcadeRenegade) on GitHub called Sidebar Diagnostics. This free utility displays all of the important system performance stats on a sidebar with a simplistic design.

Performance Stats include:
CPU
- Processor Model
- Current Clock Speed
- Temperature
- Fan Usage (if supported by your chipset)
- Overall Load %
- Individual Load %
RAM
- Utilization %
- Used GB
- Free GB
GPU (if your GPU is supported, my IGP was not)
- Current Clock Speed
- VRAM Clock
- Core Load
- Voltage
- Temperature
- Fan Usage
Drives
- % Utilized
- Used Space GB
- Free Space GB
- Read KB/s
- Write KB/s
Network
- Device Model
- In KB/s
- Out KB/s
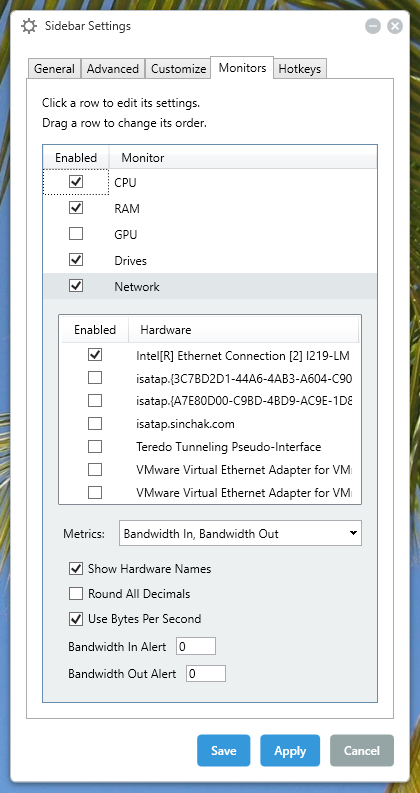
The Sidebar Diagnostics utility is highly customizable. You can customize the placement on the sidebar on your screen, or even select which monitor it displays on if you have multiple monitors. I personally like the ability to customize which monitors display on the sidebar. For example, I have one network card in my PC but there are a lot of virtual adapters registered on my system for virtual machines and other internal only interfaces. I don’t care to see the network performance of those adapters and I can hide them by removing the check next to them within Sidebar Settings on the Monitor tab.
Tip: Right now there is a bug which does not let you uncheck a network interface with a single mouse click. Instead, you must double click the check box to uncheck it.
To get stared with Sidebar diagnostics head over the Releases section of the GitHub repository by clicking this link:
https://github.com/ArcadeRenegade/SidebarDiagnostics/releases
Then just download, install and follow the prompts to get it setup. You can click on the icon in the System Tray or the Gear on the top right of the sidebar to enter Settings.
If you really enjoy Sidebar Diagnostics, the author is accepting donations to cover the development costs. You can donate by clicking here.

