I recently upgraded my home network from gigabit to 10G so I could take advantage of faster transfers between my Synology NAS, Proxmox server, and workstations. But while editing family video clips stored on my NAS, something did not feel right. Every device was connected at 10GbE, but file copy speeds were slower than expected. This made me wonder, are there bottlenecks in my network?
The most basic method to perform a speed test is to copy a large file across the network. This worked well years when disk speeds were much faster than network speeds, but with a 10GbE network, the old file copy test no longer works well because the drive will become saturated before the network.
We need a way to test the performance of the network between different devices that can fully saturate the network to find the theoretical limit to identify bottlenecks. The tool of choice for this is iperf3, the latest version of iperf. Originating as a rewrite of ttcp, iperf was developed by the National Center for Supercomputing Applications at the University of Illinois.
The iperf3 utility does not rely on your disk drives to function as everything is performed in the high-speed memory of your computer so it can saturate your network between two devices and measure the true maximum speed the device's CPUs are capable of achieving.
How to install iperf3
Using iperf3 is very simple and you do not need an internet connection as the testing is all performed locally on your network. You start by installing the utility. Then, configure one device as a server, and another as a client that measures the speed between the devices. So this means you must install the utility on at least two devices. With iperf3 available for Windows, Mac, and just about every distribution of Linux and Unix, you can easily mix and match test devices. Refer to the next sections for how to install iperf3 on the most common platforms:
How to install iperf3 on Windows
In the Microsoft app store, you will find a few GUI "wrapped" versions of iperf3 that people are selling. iperf3 is a very easy command line utility to use, avoid buying a "wrapped" version and download the latest free pre-compiled version of iperf3 from here.
I recommend the 64-bit version and download any variation of version 3 such as this direct download version of 3.1.3. Once downloaded, extract the file and open up a terminal/command prompt for the folder where you extracted iperf3.exe.
How to install iperf3 on Mac
Similar to the instructions for Windows, you can download a pre-compiled binary but there is a much easier method with homebrew which is a popular third-party package manager for Macs.
If you don't already have homebrew installed on your Mac, check out our article here to set it up.
Once you have homebrew installed, you can install the iperf3 package with this command at a Terminal prompt:
brew install iperf3
How to install iperf3 on Ubuntu / Debian
On Ubuntu, Debian, or any apt package manager compatible distribution run:
sudo apt-get install iperf3
Bonus: How to install iperf3 on iOS and Android Devices
While there are no native command line options (unless you have a jailbroken device), below are my favorite apps that have an embedded iperf3 capability:
- Apple iOS - HE.NET Network Tools.
- Apple iOS - iSH Shell. After the app is installed, open and run
apk add iperf3to install an emulated command line version of iperf3 that works as a client. - Google Android: he.net Network Tools.
How to use iperf3 to test network speeds
Setup the server device
The iperf3 binary includes both the server and the client components. To set up a server, all you need to do is run the command below with -s for server:
iperf3 -s
The server will start up and keep running until you kill it by hitting ctrl + c.
Ctrl C
stevesinchak@tweaks ~ % iperf3 -s
-----------------------------------------------------------
Server listening on 5201 (test #1)
-----------------------------------------------------------
Run a speed test on a client device
For the most basic speed test, which is all you need 99% of the time, run the following with -c for client mode:
iperf3 -c <ip address of server>
For example, the iperf3 test from my workstation to my Proxmox server (running iperf3 -s).
stevesinchak@tweaks ~ % iperf3 -c 10.0.0.15
Connecting to host 10.0.0.15, port 5201
[  6] local 10.0.0.139 port 64227 connected to 10.0.0.15 port 5201
[ ID] Interval           Transfer     Bitrate
[  6]   0.00-1.01   sec  1.10 GBytes  9.43 Gbits/sec
[  6]   1.01-2.01   sec  1.10 GBytes  9.42 Gbits/sec
[  6]   2.01-3.01   sec  1.10 GBytes  9.42 Gbits/sec
[  6]   3.01-4.01   sec  1.10 GBytes  9.41 Gbits/sec
[  6]   4.01-5.01   sec  1.10 GBytes  9.42 Gbits/sec
[  6]   5.01-6.00   sec  1.09 GBytes  9.42 Gbits/sec
[  6]   6.00-7.01   sec  1.10 GBytes  9.41 Gbits/sec
[  6]   7.01-8.00   sec  1.10 GBytes  9.41 Gbits/sec
[  6]   8.00-9.01   sec  1.10 GBytes  9.42 Gbits/sec
[  6]   9.01-10.01  sec  1.10 GBytes  9.41 Gbits/sec
- - - - - - - - - - - - - - - - - - - - - - - - -
[ ID] Interval           Transfer     Bitrate
[  6]   0.00-10.01  sec  11.0 GBytes  9.42 Gbits/sec                  sender
[  6]   0.00-10.01  sec  11.0 GBytes  9.41 Gbits/sec                  receiver

iperf Done.
If you look at the server, you will notice a similar output from iperf3 running on that device as well. Sometimes CPU limitations can come into play on a device so if you see a result you don't like, you can flip which device is the server vs the client or you can add the -R flag to the end of your client when starting the test to reverse the transfer direction.
iperf3 -c <server ip> -R
What I learned about my 10GbE network problem
First, some background on my network setup. I have a UniFi UDM-SE router connected with a 10G DAC to a UniFi 10G Aggregation Switch switch with multiple devices connected with 10G SPFs all with 10GbE link speed. I have client devices on a separate vlan and subnet from my Proxmox server and Synology NAS.
As I mentioned at the beginning of this post, when I was editing videos stored on my NAS, I noticed something just didn't feel right for 10G. So I set up an iperf3 server on my Synology NAS and ran the client on my Mac. Again, both devices were connected via 10GbE but when I ran the iperf3 test the speed maxed out at just over 3Gbps.
stevesinchak@tweaks ~ % iperf3 -c 10.0.5.10
Connecting to host 10.0.5.10, port 5201
[  6] local 10.0.0.139 port 64510 connected to 10.0.5.10 port 5201
[ ID] Interval           Transfer     Bitrate
[  6]   0.00-1.01   sec   282 MBytes  2.36 Gbits/sec
[  6]   1.01-2.01   sec   338 MBytes  2.83 Gbits/sec
[  6]   2.01-3.00   sec   350 MBytes  2.94 Gbits/sec
[  6]   3.00-4.00   sec   365 MBytes  3.06 Gbits/sec
[  6]   4.00-5.01   sec   310 MBytes  2.59 Gbits/sec
[  6]   5.01-6.00   sec   274 MBytes  2.31 Gbits/sec
[  6]   6.00-7.01   sec   264 MBytes  2.21 Gbits/sec
[  6]   7.01-8.01   sec   250 MBytes  2.10 Gbits/sec
[  6]   8.01-9.01   sec   344 MBytes  2.88 Gbits/sec
[  6]   9.01-10.00  sec   358 MBytes  3.00 Gbits/sec
- - - - - - - - - - - - - - - - - - - - - - - - -
[ ID] Interval           Transfer     Bitrate
[  6]   0.00-10.00  sec  3.06 GBytes  2.63 Gbits/sec                  sender
[  6]   0.00-10.01  sec  3.06 GBytes  2.63 Gbits/sec                  receiver

iperf Done.
At this point, I spent an hour checking all of my cabling and swapped out a cat6 for a cat7 cable to make sure there was no problem but I kept getting the same slow result. Then, I had an idea as I remembered my client and server were on different vlan subnets. When devices are on different subnets the packets have to go to the router to reach the other subnet. So I moved my client device over to the same vlan and subnet as the Synology NAS so the UDM-SE router could be avoided. I set up a new test and...
stevesinchak@tweaks ~ % iperf3 -c 10.0.5.10
Connecting to host 10.0.5.10, port 5201
[  6] local 10.0.5.139 port 64500 connected to 10.0.5.10 port 5201
[ ID] Interval           Transfer     Bitrate
[  6]   0.00-1.00   sec  1001 MBytes  8.39 Gbits/sec
[  6]   1.00-2.01   sec  1.09 GBytes  9.35 Gbits/sec
[  6]   2.01-3.00   sec  1.09 GBytes  9.38 Gbits/sec
[  6]   3.00-4.00   sec  1.09 GBytes  9.34 Gbits/sec
[  6]   4.00-5.01   sec  1.09 GBytes  9.37 Gbits/sec
[  6]   5.01-6.00   sec  1.08 GBytes  9.29 Gbits/sec
[  6]   6.00-7.01   sec  1.08 GBytes  9.25 Gbits/sec
[  6]   7.01-8.00   sec  1.09 GBytes  9.38 Gbits/sec
[  6]   8.00-9.00   sec  1.09 GBytes  9.35 Gbits/sec
[  6]   9.00-10.00  sec  1.09 GBytes  9.32 Gbits/sec
- - - - - - - - - - - - - - - - - - - - - - - - -
[ ID] Interval           Transfer     Bitrate
[  6]   0.00-10.00  sec  10.8 GBytes  9.24 Gbits/sec                  sender
[  6]   0.00-10.01  sec  10.8 GBytes  9.24 Gbits/sec                  receiver
Now that's more like it! So what was going on with my UDM-SE router? First I tried disabling all the packet inspection and security stuff as that usually adds overhead but that didn't make a difference. Then I was researching the iperf3 command and noticed there was a --parallel flag that allows you to have multiple TCP streams at once.
stevesinchak@tweaks ~ % iperf3 -c 10.0.5.10 --parallel 8
Connecting to host 10.0.5.10, port 5201
[  5] local 10.0.0.139 port 5201 connected to 10.0.5.10 port 54682
[  8] local 10.0.0.139 port 5201 connected to 10.0.5.10 port 54684
[ 10] local 10.0.0.139 port 5201 connected to 10.0.5.10 port 54698
[ 12] local 10.0.0.139 port 5201 connected to 10.0.5.10 port 54714
[ 14] local 10.0.0.139 port 5201 connected to 10.0.5.10 port 54728
[ 16] local 10.0.0.139 port 5201 connected to 10.0.5.10 port 54734
[ 18] local 10.0.0.139 port 5201 connected to 10.0.5.10 port 54746
[ 20] local 10.0.0.139 port 5201 connected to 10.0.5.10 port 54758
[ ID] Interval           Transfer     Bitrate
[  5]   0.00-1.01   sec  94.5 MBytes   789 Mbits/sec
[  8]   0.00-1.01   sec  24.0 MBytes   200 Mbits/sec
[ 10]   0.00-1.01   sec   103 MBytes   857 Mbits/sec
[ 12]   0.00-1.01   sec   201 MBytes  1.68 Gbits/sec
[ 14]   0.00-1.01   sec  66.4 MBytes   554 Mbits/sec
[ 16]   0.00-1.01   sec   117 MBytes   980 Mbits/sec
[ 18]   0.00-1.01   sec  8.12 MBytes  67.8 Mbits/sec
[ 20]   0.00-1.01   sec   214 MBytes  1.79 Gbits/sec
[SUM]   0.00-1.01   sec   829 MBytes  6.92 Gbits/sec
- - - - - - - - - - - - - - - - - - - - - - - - -
[  5]   1.01-2.01   sec   119 MBytes   999 Mbits/sec
[  8]   1.01-2.01   sec  19.0 MBytes   159 Mbits/sec
[ 10]   1.01-2.01   sec   117 MBytes   983 Mbits/sec
[ 12]   1.01-2.01   sec   218 MBytes  1.83 Gbits/sec
[ 14]   1.01-2.01   sec  70.5 MBytes   591 Mbits/sec
[ 16]   1.01-2.01   sec   101 MBytes   847 Mbits/sec
[ 18]   1.01-2.01   sec  6.50 MBytes  54.5 Mbits/sec
[ 20]   1.01-2.01   sec   235 MBytes  1.97 Gbits/sec
[SUM]   1.01-2.01   sec   887 MBytes  7.44 Gbits/sec
- - - - - - - - - - - - - - - - - - - - - - - - -
[  5]   2.01-3.00   sec   119 MBytes  1.01 Gbits/sec
[  8]   2.01-3.00   sec  19.4 MBytes   163 Mbits/sec
[ 10]   2.01-3.00   sec   102 MBytes   863 Mbits/sec
[ 12]   2.01-3.00   sec   152 MBytes  1.28 Gbits/sec
[ 14]   2.01-3.00   sec  62.9 MBytes   530 Mbits/sec
[ 16]   2.01-3.00   sec   104 MBytes   875 Mbits/sec
[ 18]   2.01-3.00   sec  6.88 MBytes  58.0 Mbits/sec
[ 20]   2.01-3.00   sec   212 MBytes  1.79 Gbits/sec
[SUM]   2.01-3.00   sec   778 MBytes  6.56 Gbits/sec
- - - - - - - - - - - - - - - - - - - - - - - - -
[  5]   3.00-4.01   sec   130 MBytes  1.08 Gbits/sec
[  8]   3.00-4.01   sec  22.1 MBytes   185 Mbits/sec
[ 10]   3.00-4.01   sec   112 MBytes   937 Mbits/sec
[ 12]   3.00-4.01   sec   198 MBytes  1.65 Gbits/sec
[ 14]   3.00-4.01   sec  61.2 MBytes   511 Mbits/sec
[ 16]   3.00-4.01   sec   105 MBytes   878 Mbits/sec
[ 18]   3.00-4.01   sec  7.88 MBytes  65.7 Mbits/sec
[ 20]   3.00-4.01   sec   216 MBytes  1.80 Gbits/sec
[SUM]   3.00-4.01   sec   852 MBytes  7.11 Gbits/sec
- - - - - - - - - - - - - - - - - - - - - - - - -
[  5]   4.01-5.01   sec   120 MBytes  1.00 Gbits/sec
[  8]   4.01-5.01   sec  20.8 MBytes   174 Mbits/sec
[ 10]   4.01-5.01   sec   102 MBytes   851 Mbits/sec
[ 12]   4.01-5.01   sec   231 MBytes  1.94 Gbits/sec
[ 14]   4.01-5.01   sec  56.4 MBytes   473 Mbits/sec
[ 16]   4.01-5.01   sec  96.4 MBytes   808 Mbits/sec
[ 18]   4.01-5.01   sec  8.25 MBytes  69.2 Mbits/sec
[ 20]   4.01-5.01   sec   214 MBytes  1.79 Gbits/sec
[SUM]   4.01-5.01   sec   848 MBytes  7.11 Gbits/sec
So why were multiple streams faster than a single TCP stream? After further research, it seems the UniFi Dream Machine Special Edition (UDM-SE) has a quad-core CPU (ARM® Cortex®-A57 at 1.7 GHz) and a single core can only route about 3Gbps. Multiple streams use multiple CPU cores on the router, which is responsible for the additional throughput. I experimented with different numbers of parallel streams and found 8 parallel TCP streams to be the best to maximize the speed.
While running this test I also watched the CPU on the UDM-SE and saw it spike to 25% on a single stream test, and jump up between 80-100% when running the parallel test.
top - 08:08:32 up 1 day, 20:15,  1 user,  load average: 8.57, 6.39, 3.92
Tasks: 169 total,   7 running, 162 sleeping,   0 stopped,   0 zombie
%Cpu(s):  2.2 us,  2.7 sy,  0.0 ni,  0.0 id,  0.0 wa,  0.0 hi, 95.1 si,  0.0 st
MiB Mem :   3946.1 total,    294.1 free,   1826.1 used,   1825.9 buff/cache
MiB Swap:   7168.0 total,   7167.0 free,      1.0 used.   1901.6 avail Mem

    PID USER      PR  NI    VIRT    RES    SHR S  %CPU  %MEM     TIME+ COMMAND
     16 root      20   0       0      0      0 R  89.7   0.0  13:17.96 ksoftirqd/1
     26 root      20   0       0      0      0 R  66.4   0.0  10:49.65 ksoftirqd/3
     21 root      20   0       0      0      0 R  61.8   0.0   6:21.66 ksoftirqd/2
      9 root      20   0       0      0      0 R  61.5   0.0  14:46.60 ksoftirqd/0
   1833 root       5 -15  597420   3236   2184 S  40.9   0.1  50:03.86 utmdaemon
2694081 root      20   0       0      0      0 R  24.9   0.0   1:11.95 kworker/u8:3+uext_wq
   1266 root       5 -15  122464  33904  17536 D  16.3   0.8 140:18.58 ubios-udapi-ser
    834 root      20   0  313240  12268  10772 S  11.0   0.3  32:41.19 ulcmd
    847 root      20   0  517728  14320  11412 S   3.7   0.4   3:00.32 utermd
    168 root      20   0       0      0      0 S   3.0   0.0   0:12.42 usb-storage
2698450 root      20   0       0      0      0 I   2.7   0.0   0:04.01 kworker/1:1-events
     10 root      20   0       0      0      0 I   2.0   0.0   1:28.44 rcu_sched
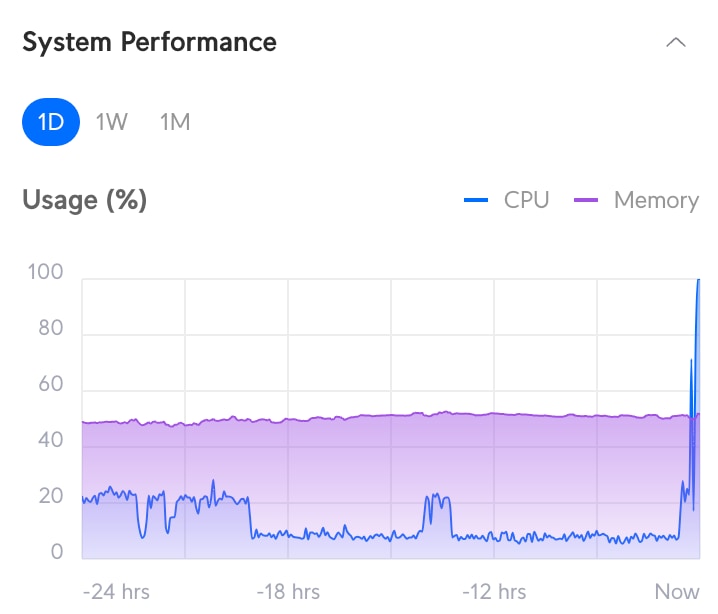
Looking at the UDM-SE System Performance chart in the UniFi Controller, you can also see the CPU spiking to 100% with the parallel test, or 25% earlier when I was running the single stream test.
At the end of the day, the UDM-SE is a great device, but it is simply not powerful enough to route traffic between vlans at 10GbE speed. To solve my problem, I moved my Synology to the user vlan to bypass the router and the difference is awesome!